US Road Rage Report
Explore the states in which you are most likely to encounter road rage.
Overview
Whether you permanently live in the US, own your own car, have a car subscription, or you’re visiting the country and are renting a car, driving can often be a stressful and anxiety-inducing experience.
Violent road rage incidents are on the rise in the U.S., with an estimated eight out of ten drivers demonstrating aggressive behavior when on the road. This can include tailgating, running red lights, and preventing other drivers from changing lanes.
Actions like these can also lead to what is known as ‘road rage’, which involves intimidating other drivers through things such as rude gestures, profanities, headlight flashing, or breaking.
In some states, road rage and aggressive driving are more common, which may mean that drivers are potentially at greater risk when they get behind the wheel. We’ve taken a deep dive into data relating to these kinds of incidents to determine which U.S. states you are most likely to encounter road rage in when driving.
The worst US states for road rage

1. Arizona - 8/10 road rage score
The state encountering the most road rage and aggressive driving is Arizona, earning a road rage score of 8/10. The state came out on top for confrontational drivers, as well as positioning at number 12 for the ranking of the most car accidents. A huge 81% of drivers in Arizona have been yelled at, insulted, or threatened when driving. As well as this, a shocking 22.5% of drivers in the state have been forced off the road.
There were a total of 1,180 deaths in the state in 2021 due to motor vehicle crashes, equating to 16.2 deaths per 100,000 residents. This means Arizona ranks at position 16 for the most deaths per 100,000 people. In the same year, there were 1.6 deaths for every 100 million miles traveled in Arizona, which is the thirteenth-highest figure. People found to be committing aggressive driving in the state can receive up to six months imprisonment and a maximum fine of $2,500.
With Arizona ranking in the top 20 for all four factors, this shows a strong link between the level of road rage encountered and the number of fatal car accidents in the state.
2. Montana - 7.22/10 road rage score
In second place is the state of Montana, which received a road rage score of 7.22/10. The state placed first for the most car accidents, as well as appearing at position 11 on the ranking of confrontational drivers. 41.5% of drivers in Montana have been cut off on purpose when driving, with another 33.5% having been blocked from changing lanes.
In 2021, there were 1.77 deaths for every 100 million miles traveled in Montana, which is the sixth-highest figure between all 50 states. In the same year, there were a total of 239 deaths due to motor vehicle crashes, which equates to 21.6 deaths per 100,000 residents. This means Montana ranks at position five for the most deaths per 100,000 people. Over 50% of road fatalities in the state are caused by impaired driving, with a further 39% caused by speeding.
Similarly to Arizona, the state of Montana also ranks within the top 20 across all four factors, meaning that a lot of fatal car accidents may occur due to road rage.
3. South Carolina - 6.74/10 road rage score
Coming in third is South Carolina, earning a road rage score of 6.74/10. Despite placing second for the most car accidents, the state sits in the middle for confrontational drivers at position 30. 46.5% of drivers in South Carolina have been yelled at, insulted, or threatened while driving, with a further 41.5% having been blocked from changing lanes.
There were almost 1,200 deaths in the state in 2021 due to motor vehicle crashes, equating to 23.1 deaths per 100,000 residents. In the same year, there were 2.08 deaths for every 100 million miles traveled in South Carolina. 46% of road fatalities in the state are caused by speeding, with a further 36% caused by impaired driving.

The best US states to avoid road rage

1. Minnesota - 0.94/10 road rage score
The state encountering the least road rage and aggressive driving is Minnesota, earning a road rage score of just 0.94/10. On the ranking of the most car accidents, the state appears towards the bottom of the list at position 46. It is positioned at number 39 on the ranking of confrontational drivers. Just 5.5% of drivers in Minnesota have been forced off the road due to aggressive driving. However, 54.5% have been yelled at, insulted, or threatened.
There were a total of 488 deaths in the state in 2021 due to motor vehicle crashes, equating to 8.5 deaths per 100,000 residents. In the same year, there were 0.85 deaths for every 100 million miles traveled in Minnesota. 34% of road fatalities in the state are caused by impaired driving, with a further 31% having been caused by speeding.
2. Hawaii - 1.18/10 road rage score
In second place is the state of Hawaii, which received a road rage score of just 1.18/10. The state placed at position 36 on the ranking of confrontational drivers and at position 42 on the ranking of the most car accidents. Hawaii has actually seen a 21% decrease in the number of fatalities due to car accidents year-on-year.
In 2021, there were 0.94 deaths for every 100 million miles traveled in the state. In the same year, there were a total of 94 deaths due to motor vehicle crashes, which equates to 6.5 deaths per 100,000 residents. In Hawaii, 44% of car accidents are caused by speeding, with a further 40% caused by impaired driving.
3. New Hampshire - 1.22/10 road rage score
Following closely behind is New Hampshire, earning a road rage score of just 1.22/10. On the ranking of the most car accidents, the state is positioned at number 34. It appears towards the bottom of the list on the ranking of confrontational drivers at position 45. Just 4% of drivers in New Hampshire have been forced off the road when driving. However, 33.5% have been yelled at, insulted, or threatened.
There were almost 120 deaths in the state in 2021 due to motor vehicle crashes, equating to 8.5 deaths per 100,000 residents. In the same year, there were 0.9 deaths for every 100 million miles traveled in New Hampshire. 41% of road fatalities in the state are caused by impaired driving, with a further 36% having been caused by speeding.
The worst US states for confrontational drivers

1. Arizona - 100/100 score on confrontational drivers ranking
The state with the most confrontational drivers is Arizona, scoring 100/100 and appearing in first place on the ranking of confrontational drivers. The state has the second-highest percentage of drivers who claim to have been forced off the road due to aggressive driving, standing at 22.5%.
As mentioned previously, the most common form of road rage in Arizona is being yelled at, insulted, or threatened, with a huge 81% of drivers claiming to have experienced this. 56.5% of drivers in the state have purposely been blocked from changing lanes when on the road, and over 50% have also been cut off on purpose.
2. Rhode Island - 98.46/100 score on confrontational drivers ranking
In second place is Rhode Island, which received a score of 98.46/100 and was placed at position two on the ranking of confrontational drivers. The state has the highest percentage of drivers who claim to have been yelled at, insulted, or threatened when on the road, standing at a huge 96.5%. This makes it the most common form of road rage to be encountered when driving in Rhode Island.
The second most common form of road rage in the state is being purposefully blocked from changing lanes (63.5%), closely followed by being cut off on purpose (62.5%). 10.5% of drivers in Rhode Island also claim to have been forced off the road.
3. West Virginia - 97.82/100 score on confrontational drivers ranking
Following closely behind is West Virginia, which scored 97.82/100 and appeared in third place on the ranking of confrontational drivers. The state has the second-highest percentage of drivers who claim to have been yelled at, insulted, or threatened when on the road, standing at 94.5%. Similarly to Rhode Island, this also makes it the most common form of road rage when driving in West Virginia.
The state also scores similarly to Rhode Island when it comes to being purposefully blocked from changing lanes (61.5%) and being cut off on purpose (63%). However, it does score higher for the percentage of people claiming to have been forced off the road when driving in West Virginia, standing at 13.5%.
The states with the most fatal car accidents

1. Montana - position 1 on fatal car accidents ranking
The state with the most fatal car accidents is Montana, appearing at the top of the list in first place on the ranking. There are approximately 0.017 fatal car accidents per capita in the state, leading to 0.019 fatalities. This is an increase of 16% year-on-year. The majority of these fatal car accidents (51%) are caused by impaired driving, and 39% are caused by speeding.
2. South Carolina - position 2 on fatal car accidents ranking
In second place is South Carolina, which appeared in position two on the ranking of the most fatal car accidents. On average, there are 0.019 fatal car accidents and 0.020 fatalities per capita in the state. This is a year-on-year increase of just 6%. 46% of these fatal car accidents are caused by speeding, and 36% are caused by impaired driving.
3. Wyoming - position 3 on fatal car accidents ranking
Coming in third is the state of Wyoming, appearing in third place on the ranking of the most fatal car accidents. There are approximately 0.020 fatal car accidents per capita in the state, leading to 0.022 fatalities. Despite Wyoming having one of the highest rates of car accidents and fatalities, this is actually a decrease of 14% year-on-year. 39% of these fatal car accidents are caused by impaired driving, and 33% are caused by speeding.
The states with the most deaths due to car accidents

1. Mississippi
Total fatal car accidents - 697
Total deaths due to car accidents - 772
Deaths per 100,000 residents due to car accidents - 26.2
The state with the most deaths per 100,000 residents due to car accidents is Mississippi. In 2021, there were almost 700 fatal car accidents in the state, which led to a total of 772 deaths. This equates to 26.2 fatalities per 100,000 residents. The majority of these deaths (54%) were due to single-vehicle crashes and most of them occurred in rural areas of Mississippi (59%).
2. South Carolina
Total fatal car accidents - 1,112
Total deaths due to car accidents - 1,198
Deaths per 100,000 residents due to car accidents - 23.1
In second place is South Carolina, where, in 2021, there were over 1,110 fatal car accidents. This led to almost 1,200 deaths, equating to 23.1 fatalities per 100,000 residents. 37% of these deaths were car occupants and just 1% were large truck occupants. 50% of those killed were unrestrained when they became fatally injured.
3. Arkansas
Total fatal car accidents - 631
Total deaths due to car accidents - 693
Deaths per 100,000 residents due to car accidents - 22.9
Coming in third is the state of Arkansas, where there were over 630 fatal car accidents in 2021. This led to 693 deaths, which equates to 22.9 fatalities per 100,000 residents. Most of these deaths involved car occupants (33%) and pickup and SUV truck occupants (32%). Only 1% of the total deaths involved cyclists.
The states with the most deaths per 100 million miles traveled due to car accidents
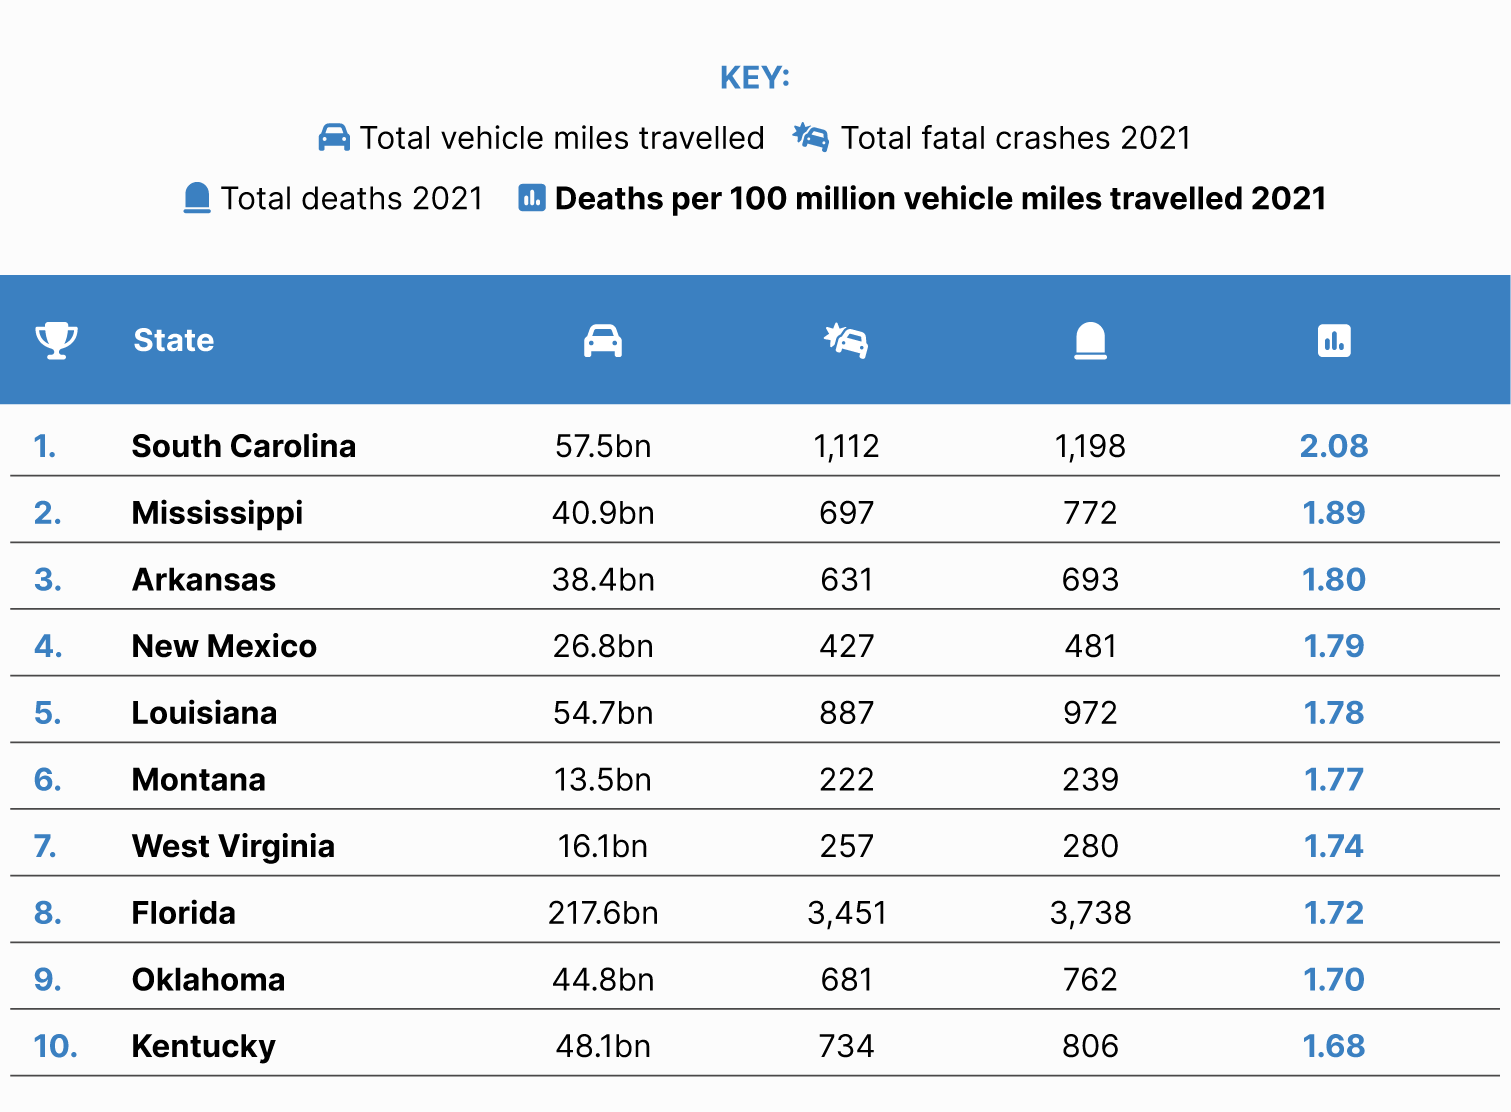
1. South Carolina
Total fatal car accidents - 1,112
Total deaths due to car accidents - 1,198
Total vehicle miles traveled - 57.492 billion miles
Deaths due to car accidents per 100 million miles traveled - 2.08
The state with the most deaths per 100 million miles traveled due to car accidents is South Carolina. As mentioned previously, there were over 1,110 fatal car accidents in 2021, leading to almost 1,200 deaths. Throughout the same year, drivers in South Carolina traveled over 57.492 billion miles, meaning that there were 2.08 deaths for every 100 million miles traveled. The majority (52%) of these deaths were caused by single-vehicle crashes and occurred in rural areas of South Carolina (55%).
2. Mississippi
Total fatal car accidents - 697
Total deaths due to car accidents - 772
Total vehicle miles traveled - 40.853 billion miles
Deaths due to car accidents per 100 million miles traveled - 1.89
In second place is the state of Mississippi, where, as mentioned previously, there were almost 700 fatal car accidents leading to over 770 deaths in 2021. During the same year, drivers in Mississippi traveled over 40.853 billion miles, meaning that there were 1.89 deaths for every 100 million miles traveled. 41% of these deaths involved car occupants, with the same percentage being unrestrained.
3. Arkansas
Total fatal car accidents - 631
Total deaths due to car accidents - 693
Total vehicle miles traveled - 38.427 billion miles
Deaths due to car accidents per 100 million miles traveled - 1.80
Coming in third is the state of Arkansas, where, as mentioned previously, there were over 630 fatal car accidents leading to almost 700 deaths in 2021. Throughout the same year, drivers in Arkansas traveled over 38.427 billion miles, meaning that there were 1.80 deaths for every 100 million miles traveled. The majority of these deaths (52%) were caused by single-vehicle crashes and occurred in rural areas (59%).
The states with aggressive driving laws
There are currently only 15 states that have addressed aggressive driving in their legislatures and only 11 of these have specific aggressive driving actions. The punishments, which can include licensing action, fines, and even imprisonment, can vary depending on the state.
The state with the shortest jail sanction is Delaware, with aggressive driving offenders only spending between 10 and 30 days imprisoned. There are four states that have a maximum jail sanction of six months: Arizona, Nevada, Utah, and Virginia. The state with the longest jail sanction is California. Those caught committing aggressive driving offenses in the state can receive a maximum imprisonment of four years. Offenders in New Jersey and Rhode Island receive no jail sanction for aggressive driving offenses.
The maximum fine can vary massively depending on the state, ranging from just $50 all the way to $10,000. The state with the smallest initial fine is New Jersey, with offenders being charged a minimum of $50. However, this can increase to $150 and there is also a $250 mandatory surcharge. California has the highest maximum fine, standing at $10,000. The maximum fine for aggressive driving offenders in North Carolina is determined at the discretion of the court.
There are multiple states that take no licensing action when aggressive driving offenses are committed. This includes the likes of Georgia, Indiana, New Jersey, North Carolina and Delaware. However, in Delaware, offenders will receive a maximum licensing action of 30 days for any subsequent offenses within three years.
There are similar rules in the states of Nevada and Virginia. In Washington, offenders have the chance to complete traffic school as a punishment. Failure to do so within 90 days will result in the suspension of either the offender’s license or the privilege to operate a motor vehicle in the district for a certain time period. This is determined by the Department of Motor Vehicles. The longest licensing actions are six months and occur in California and Virginia.
Methodology:
We used Forbes’ Confrontational Drivers Ranking which was created to determine which states encounter the most violent road rage.
We also used Forbes’ Car Accident Statistics which were created to determine which states have the most car accidents.
We used IIHS’ Fatality Facts 2021 to gather the rate of deaths per 100,000 population and per 100 million vehicle miles.
We used AAA’s Aggressive Driving Laws to find out which states have laws surrounding aggressive driving and whether these involve imprisonment, fines, or licensing actions.
For each state, we gave a score out of 10 for each factor before taking an average of all five scores to determine the final road rage score.